
If you are an independent pharmacy owner, you’ve probably heard a lot of buzz about making data-driven decisions.
There are many ways you can collect data in your store, like through your point-of-sale system, loyalty program, or email marketing software.
But to make sense of all that data, you’re going to have to crunch some numbers and embrace statistics. One of the most common statistical approaches to analyzing data is called a “linear regression.”
Linear regression is a relatively simple mathematical formula that allows you to sort through all the data you have at your fingertips and come to accurate conclusions about which aspects of your business are having the biggest effect on its success.
Linear regression formula
To understand linear regression, you’ll have to remember back to your middle school algebra class. The basic formula for a linear regression follows this equation:
Y = a + bX
In this formula, X represents the independent variable and Y represents the dependent variable. The b represents the slope of the line, while a represents the intercept, or the value of Y when X is 0.
If that just sounds like a jumble of letters, picture a scatter plot.
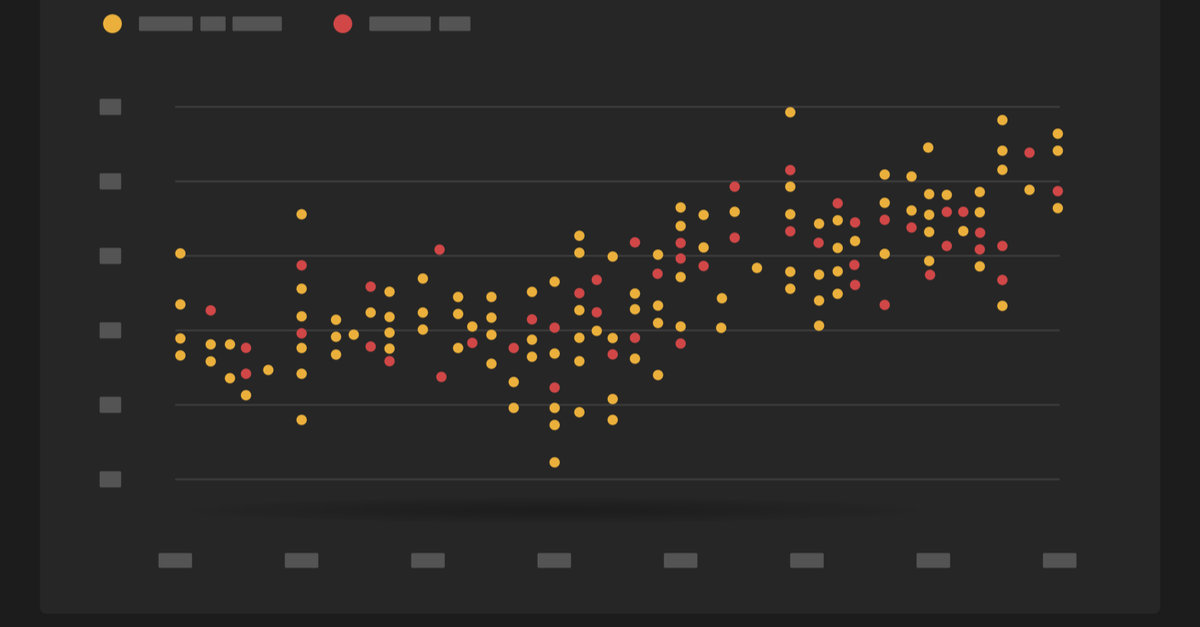
In this scatter plot, you’ll be measuring X as prescriptions per day and Y as gross profit. Over a month-long period, place a dot on the scatter plot for every day that notes how many prescriptions you filled on the X-axis of the graph (left to right) and what your gross profit was for the day on the Y-axis (up and down).
At the end of the month, you will probably notice that the dots have a general pattern — the more prescriptions you filled, the higher your gross profit was. If you draw a line that generally follows that pattern, you’ll get b, or the “line of best fit.”
In some situations, you’ll find that the dots on your scatter plot align very closely to your line of best fit, meaning that there is a strong relationship between the two variables. In other situations, the dots will be much more spread out, which means that the relationship isn’t as strong.
The amount of variation is enumerated by the R-squared value, which is a decimal between -1 and 1. The closer the decimal is to 0, the weaker the correlation is. However, if you have an R-squared value of .93, that means there is a strong positive correlation between your two variables, while an R-squared value of -.93 means there is a strong negative correlation.
The R-squared value is ultimately the value you are looking for in a linear regression, and it can be found using Microsoft Excel.
Using Microsoft Excel to calculate a regression
Once you understand the principles behind linear regression, the good news is that you don’t have to do any math yourself to find it if you have Microsoft Excel.
Follow these steps:
- Install the Data Analysis ToolPak
- Fill out the data for your independent variable in one column and the data for your dependent variable in another.
- Click on “Data Analysis” in the Data tab. A window will pop up with many different analysis options.
- Click on “Regression.”
- Where requested, input the cell range for each variable and click “OK.”
Then Excel will do all the work for you. A new sheet will pop up with information about your data, but all you need to look for is the R-squared value, which you can find in the table labeled “Regression Statistics.”
For screenshots of this process, check out Investopedia.
Applications of a linear regression analysis
Once you have learned how to perform a linear regression and find an R-squared value, you can use that information to better understand your business.
Predict performance
If something has worked for you in the past, there’s a good chance it will work for you in the future. By using regression analysis, you can make reasonable predictions about what is going to happen in your pharmacy under specific conditions.
Regression analysis might show you that there is a correlation between the number of marketing emails a patient gets and their basket size when they visit the pharmacy, so you can forecast how a new marketing campaign will affect your business.
Make decisions
Use the information found in a regression analysis to help you make informed decisions about your business. For example, a regression analysis might indicate a poor correlation between free samples and sales of those products.
Armed with this information, you can make the decision to concentrate on other types of in-store promotions that have a stronger record of success.
Discover new insights
One of the most valuable parts of regression analysis is taking the large quantity of data you have sitting inside your pharmacy technology and unlocking the secrets contained in it.
By comparing different sets of data, you might discover a relationship that you didn’t know existed.
You might discover that your patients are much more likely to purchase additional over-the-counter items when they do curbside pickup than they are when they get home delivery.
With that information, you can either take advantage of those more eager curbside buyers or do more to convince delivery patients to buy OTC items.
A word of warning
Although linear regression can be a powerful tool to identify trends in your pharmacy, be careful not to blindly trust the results without further investigation.
Remember that correlation does not equal causation.
A linear regression can prove that there is a correlation between two variables. That means there’s a pattern, and that those two variables have a relationship to one another. But a linear regression cannot prove causation, which means that changing one variable will cause the other variable to change.
For example, if you run a linear regression comparing the foot traffic in your pharmacy and the temperature outside. You may find that there is a strong relationship between foot traffic and temperature — that when it’s hot out, you have higher foot traffic.
However, this doesn’t mean that the heat is causing more people to visit the store. Instead, it could be a sign that hot weather and pharmacy foot traffic share a third causal variable that hasn’t been investigated yet.
To figure out if a regression relationship indicates causation in addition to correlation, you’ll have to do some research.
To find out the relationship between temperature and foot traffic, you can ask patients why they visited the pharmacy that day. You may find that more people are stopping in to buy sunglasses, which tells you it isn’t the heat that caused them to visit but the increased sun exposure.
A Member-Owned Company Serving Independent Pharmacies
PBA Health is dedicated to helping independent pharmacies reach their full potential on the buy-side of their business. Founded and run by pharmacists, PBA Health serves independent pharmacies with group purchasing services, wholesaler contract negotiations, proprietary purchasing tools, and more.
An HDA member, PBA Health operates its own NABP-accredited warehouse with more than 6,000 SKUs, including brands, generics, narcotics CII-CV, cold-storage products, and over-the-counter (OTC) products — offering the lowest prices in the secondary market.