Inside: You could get more out of your pharmacy’s front end. Learn how planograms can increase your pharmacy’s front-end sales (and do the heavy lifting for you).
Is your pharmacy’s front end producing less profit than you hoped?
Time to trade in your best-laid plans for proven planograms.
Planograms are guides for arranging retail shelves to maximize front-end sales.
These visual diagrams show pharmacies exactly where to place their front-end products. They offer a plan based on research-backed factors indicating products should increase profits and turn quickly.
“Independent pharmacy margins are shrinking so much behind-the-counter that they need to get that penny profit wherever they can,” said Kyle Lentz, Category Analyst at Hamacher Resource Group (HRG), a firm that improves results across the retail supply chain by addressing dynamic needs such as assortment planning and placement, retail execution strategy, fixture coordination, item database management, brand marketing, and analytics.
“Retailers that don’t take advantage of that 10 to 15 percent in front-of-the-counter sales are losing a great deal of money,” he said. “It’s a small piece of the pie, but can be a profitable piece if done correctly.”
And that’s the ultimate goal of planograms.
HRG combines rigorous research and experience to create planograms that help pharmacies maximize sales and profits. “We want to make sure that the items are turning for our retail partners,” Lentz said.
The purpose of planograms
With thousands of different front-end products per category, how does an independent pharmacy owner know what to sell?
Although manufacturer and distributor representatives visit pharmacies to educate owners and to help them merchandise products, it doesn’t occur as much as it did years ago.
“Planograms are a replacement for that store visit,” Lentz said. “We consider the information manufacturers provide as we perform our objective analysis of sales and unit movement data to create the best, most profitable planogram.”
Planograms can eliminate almost all of the front-end planning for the pharmacy. So, the pharmacy owner can increase front-end sales without sacrificing as much time and as many resources.
With a department of category management specialists, HRG provides the expertise, market data, and resource capacity pharmacy owners don’t have.
“Pharmacists don’t have the time to look into all the data and products our teams are reviewing. When they use our planograms, they’re leveraging our team’s expertise but they also can make adjustments to meet the particular needs of their local clientele,” said Megan Moyer, Senior Marketing Communications Specialist at HRG.
How planograms work
Planograms showcase how to arrange products based on general categories and subcategories. For example, cold and allergy is a general category, while cough drops, allergy, and cold and flu are subcategories.
Planograms depict how to arrange the products in a category by subcategory, and then individual SKUs (stock keeping units) within the allotted shelf space. “We’re organizing the logical subcategories and products to make available space as profitable as possible for our independent retailers,” Lentz said.
HRG’s category analysts arrange the products in the planograms to mirror how people shop. “We create logical adjacencies to make shopping easier for the patient,” Lentz said. “We first think about how the shopper instinctively approaches the category.”
For pharmacies, that sometimes means arranging subcategories according to the natural progression of an illness.
A patient feeling the onset of a cold, for example, might first grab lip care and throat drops because dry lips and a sore throat are the first signs of a cold. So, patients will find those items next to each other on the shelf, along with other pre-cold products.
HRG also considers other factors for product placement, such as:
- Current product and industry trends
- Product sales and profitability
- Product demand and availability
The most profitable products typically go on the shelves 30 to 54 inches from the floor, the point where people’s vision rests, known as the cone of vision.
Products that shoppers seek out no matter where they are, called destination items, can go on shelves outside of the cone of vision.
HRG also takes into account the broader arrangement of the pharmacy. “We’re looking at creating a unified health, beauty, and wellness space in the front end that is professional and inviting for the customers to shop,” Lentz said.
Narrowing products down
While that explains the basic logic of planograms, it doesn’t explain how to get from a category containing 2,500 items—the number of cold and allergy products HRG may have in its file at once—down to the limited number that can actually fit on a shelf.
The primary filter HRG uses to determine product selection is profitability. “We want to make sure we’ve got that subcategory representation based on the volume of sales and profitability,” Lentz said.
HRG narrows the list to the highest-margin and quickest-turning items using:
- Its wholesale withdrawal data containing multitudes of product attribute information
- A rigorous process of meetings with manufacturers
- Internal debate with colleagues
“We’re looking at the best items that go into that category, including unit sales, dollar sales, and profitability,” Lentz said. “So, we’re looking at items that produce strong margins for retailers.”
Retailers that subscribe to HRG’s TEMPS® Category Manager program receive tools and materials for one to two categories each month including signage, shelf labels, endcap ideas, and new item information.
“The planogram is an easy roadmap to follow,” Lentz said. “They can look at the planogram, make sure their shelves are set correctly, and if warranted, incorporate items that do well in their region or with their customer base.”
Check This Out: Pharmacy Merchandising Planogram Example
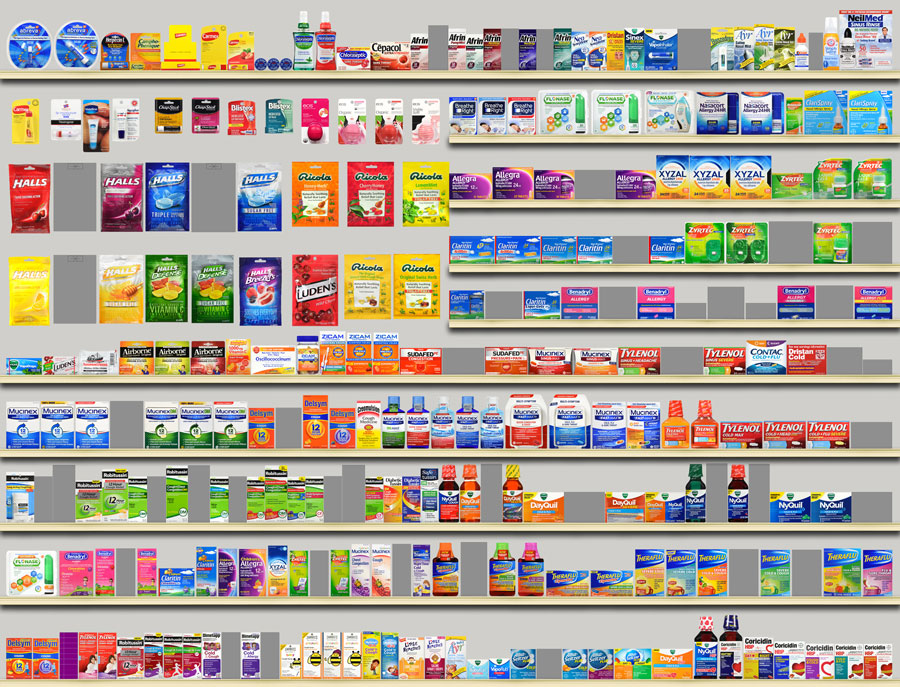
An inside look at the factors that make planograms successful and other product assortment considerations for independent pharmacies from Hamacher Resource Group (HRG).
Cone of Vision
The most profitable shelves are 30 to 54 inches from the floor, in the average shopper’s line of vision. Place the most popular products here.
Timing
HRG analysts consider several factors to determine when categories are sent during the year, such as typical timing of new item introductions in the category. Or, if there’s a seasonal connection.
For example, HRG completes a seasonally relevant planogram in March to capture the allergy season that begins in April.
New Items
New items are the lifeblood of any category. HRG does a full review of all the new items released each month considering earning potential, promotional spend, category growth, production orientation, and innovation.
Products That Address Side Effects
Pharmacies should stock over-the-counter (OTC) items that resolve the common side effects of their top 50 prescribed medications. For example, high SPF and specialty sun care items can help patients address the photosensitivity some prescriptions may cause.
Destination Products
Destination items are those that customers specifically go to a store to get. For example, in the cold and allergy department, destination items include children’s products and popular nasal allergy and flu relief items.
Customers search for destination products regardless of where they’re positioned on the shelf, so these items are typically on lower shelves.
Niche Items
Niche items are those that competitors wouldn’t carry and can only be found at their independent pharmacy, such as specialty supplements or local products.
Never Outs® Items
HRG Never Outs are items HRG analysts have determined pharmacies never want to run out of. They can represent up to 50 percent of sales within a category. If shoppers don’t find them, they might walk out empty-handed.
Manufacturer-Supported Products
Some manufacturers supply pharmacies direct support through marketing programs that may include advertising, coupons, brochures, signage, circulars, and online initiatives to help them push sales.
A Member-Owned Company Serving Independent Pharmacies
PBA Health is dedicated to helping independent pharmacies reach their full potential on the buy-side of their business. Founded and run by pharmacists, PBA Health serves independent pharmacies with group purchasing services, wholesaler contract negotiations, proprietary purchasing tools, and more.
An HDA member, PBA Health operates its own NABP-accredited warehouse with more than 6,000 SKUs, including brands, generics, narcotics CII-CV, cold-storage products, and over-the-counter (OTC) products — offering the lowest prices in the secondary market.